
Tracking impressions on repositories
When working on open source projects, I often wonder how to improve the experience for my users. In order to improve my users experience, I first need to be able to measure and monitor it. On a website, I have Google Analytics which can help me understand my users paths through my site. This capability isn’t as accessible on GitHub or GitLab as it requires JavaScript execution. In this post, I will demonstrate how you can set up Google Analytics to track impressions on GitHub repositories.
Google Analytics implements a tracking pixel. This allows it’s users to track their consumers behavior across their site. For browsers, this often requires a JavaScript snippet. This approach however, breaks down when you start to talk about markdown content on GitHub.
Fortunately, Google Analytics supports an image ping approach.
While less common in browsers, this approach is frequently used in emails.
Using markdown images, we can leverage the image ping to embed a tracking pixel into README.md files.
Set up a Google Analytics property
The first step in this process is to set up a new property for GitHub. Google Analytics offers both web and app support. You only need web support. When creating the property, you will be prompted for the base URL for your site. Enter the GitHub URL including your organization or user.
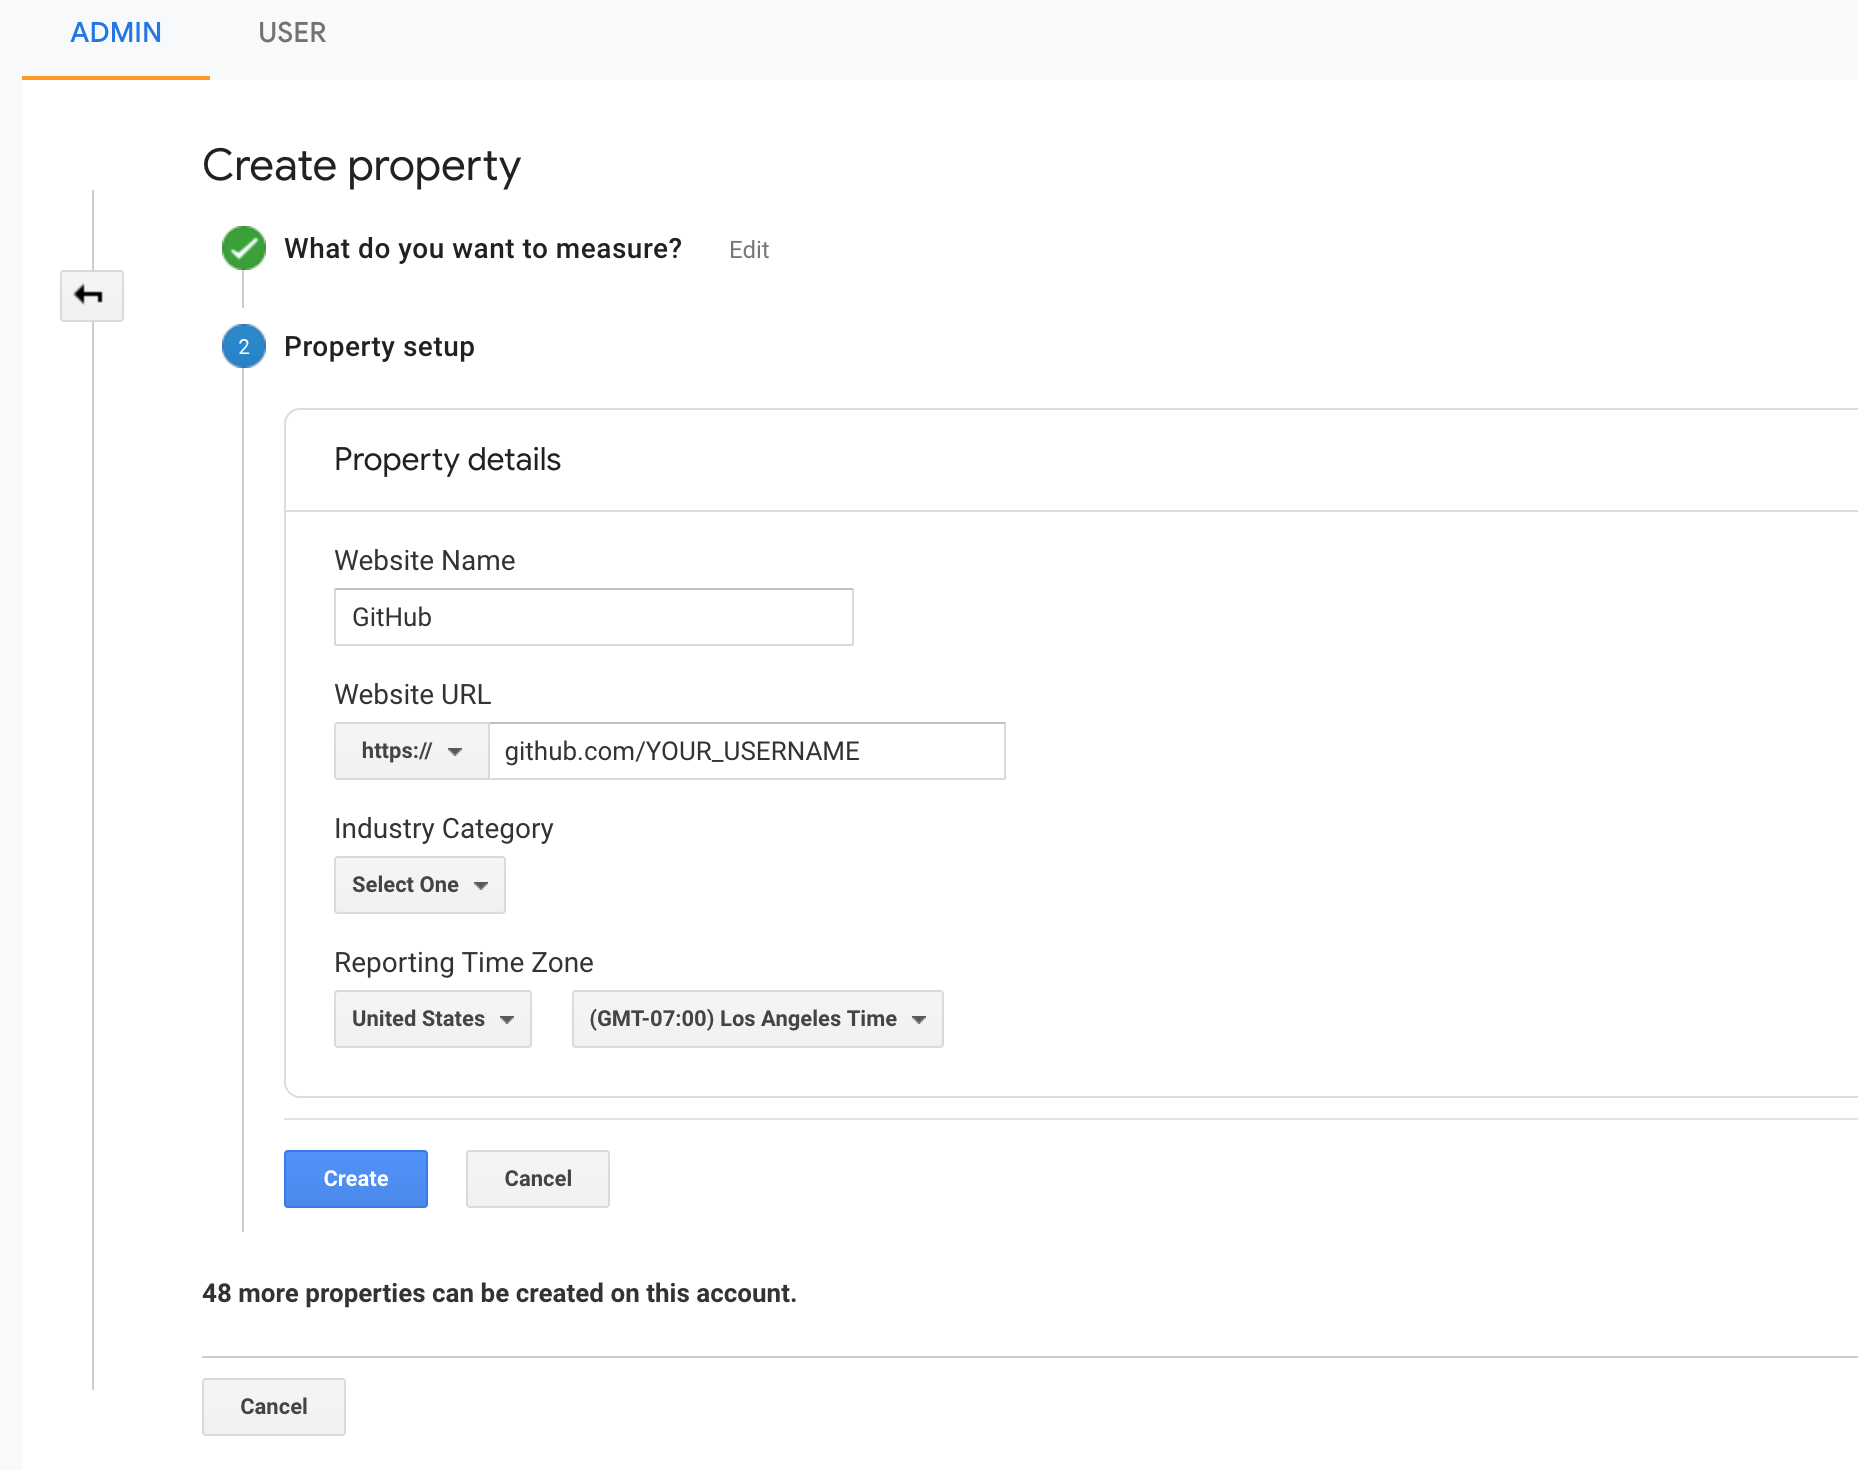
By using this prefix, you can use the same tracking key across all your projects.
From there, complete the remainder of the form appropriately.
Once created, you’ll be given a tracking key.
These keys tend to follow the form UA-xxx-y.
Save this as it will be used to generate the pixel we will be embedding in our repository.
Generate an image ping URL for your project
Once you obtain a tracking key, you’re able to generate embed pixels for your repositories.
Google’s image ping URL can get rather long.
To help format the URI, I leveraged a little bit of JavaScript.
With the built in querystring library, the work went rather quickly.
Below, you can see a copy of the JavaScript I used to generate my image.
const qs = require('querystring');
async function main() {
const key = process.argv[2]; // your tracking key (e.g UA-xxx-y)
const path = process.argv[3]; // your repositoriy (e.g mjpitz/go-gracefully)
const query = qs.stringify({
v: 1, // version
cid: 555, // client id
t: 'pageview', // the type
ec: 'repo', // the category
ea: 'open', // the action
dp: path, // document path
dt: path, // document title
tid: key, // tracking key
})
console.log(``);
}
main().catch((e) => console.error(e));This script expects two arguments: your tracking key (US-xxx-y) and a path (mjpitz/go-gracefully).
When run, this script will output a markdown image that you can paste into your projects README.
$ node repo-ga-beacon.js UA-xxx-y mjpitz/go-gracefully
You can repeat this process for any project you want to be included in your report. For my project deps.cloud, this is valuable as we can see which repositories are hit the most. Using this information, we can better redirect our clients to pages where they can find more information.
Why should you do this?
There are many reasons you should do this. For one, it helps understand if there is an issue with your content or the discovery of it. Instead of wondering whether a project has the reach you intended it to, you can refer to the number of visitors.

In marketing, impressions, clicks, and conversions are used to determine the success of a given advertisement. Similarly, we can use this technique to track the success of an open source project. Most (popular) projects are already using some kind of heuristic to measure success of their projects. Number of issues created, stars, watches, forks, follows, etc. While these metrics are great, they represent conversions not impressions. With an added image ping you can now track conversion rates. That is the percentage of visitors that visit your projects, and take an action.
Thank you for joining me in this series! Be sure to check out the other parts.