
Raspberry Pi Cluster Monitoring
In my last few posts, I talked a bit about my at home development cluster. Due to the flexibility of my cluster, I wanted to provide a monitoring solution that was valuable across each technology I use. In this post, I discuss how monitoring is setup on my cluster. I’ll walk through setting up each node, the Prometheus server, and the Graphana UI.
First, if you haven’t read my previous posts, I suggest going back and giving them a quick read.
Historically, I haven’t put much monitoring in beyond the basic orchestrator level tooling. This was due to the lack of native ARM support on the Prometheus project. Sure there were a couple personal forks running out on the web. Some of them were well documented, but I tended to resort to compiling it myself. Many people in the ARM community have been waiting for support upstream.
This should be available soon hopefullyhttps://t.co/3TXc4SjIug
— Simon P (@SimonHiker) March 9, 2019
6 days ago, Prometheus merged in support for ARM based architectures. I briefly stumbled across a tweet this week where someone mentioned that native support was now offered upstream. Unfortunately, I managed to misplace that tweet. With some free time on my hands, I decided to go looking for the images and get a solution running on my cluster at home.
Running node_exporter on each node
node_exporter is a project from the Prometheus team. It provides host level information such as cpu, memory, and disk usage. It also provides more detailed information such as open and max file descriptor counts, memory swap, cpu steal, etc. In order to get started with the project, you either had to use the container image or go out and compile your own binary. With the recent introduction of the ARM image, running this has become a bit easier.
$ docker run -d \
    --name "node-exporter" \
    --network "host" \
    --pid "host" \
    --restart "always" \
    -v "/:/host:ro,rslave" \
    prom/node-exporter-linux-arm64:master \
    --path.rootfs /host
You can verify that this process started up successfully by curling the metrics endpoint of the process. Over time, this page will be updated based on the current usage of the system.
$ curl http://${ip_address}:9100/metricsRepeat this process for each node within your cluster.
Picking a monitoring node
I want to explicitly call out to the “monitoring” node aspect of this section. A monitoring node in this case is simply a node who has a large amount of disk space. Prometheus works by aggregating data from different exporters. Since it collects all this information in one place, you will need to ensure you have enough storage. Alternatively, you can leverage an attachable storage solution, like Ceph. Since my setup is rather minimum, I run this on my laptop during times of experimentation.
Running Prometheus and Graphana
Before starting the Prometheus server, you need a configuration file. This file tells Prometheus where it can gather metrics from. In this case, we use a static_config that points at every node in the cluster.
global:
  scrape_interval: 1m
  scrape_timeout: 10s
  evaluation_interval: 1m

scrape_configs:
  - job_name: node-exporter
    static_configs:
      - targets:
        - 192.168.1.100:9100
        - 192.168.1.101:9100
        - 192.168.1.102:9100
        - 192.168.1.103:9100
        - 192.168.1.104:9100
        - 192.168.1.105:9100
        - 192.168.1.106:9100
        - 192.168.1.107:9100
        - 192.168.1.108:9100
        - 192.168.1.109:9100
Once the configuration file is defined, I started to look into how to deploy this setup.
I wound up finding docker-compose files to be the best way to managed this.
By using something like docker stack deploy, we’re able to leverage the configs semantic.
version: "3.7"

volumes:
  prometheus-data:
  graphana-data:

configs:
  prometheus-config:
    file: ./prometheus.yaml

services:
  prometheus:
    hostname: prometheus
    configs:
      - source: prometheus-config
        target: /prometheus.yaml
    volumes:
      - prometheus-data:/prometheus
    ports:
      - 9090:9090
    image: prom/prometheus
    command: [
      --config.file, /prometheus.yaml,
      --storage.tsdb.path, /prometheus
    ]

  graphana:
    hostname: graphana
    volumes:
      - graphana-data:/var/lib/grafana
    ports:
      - 3000:3000
    image: grafana/grafana
Alternatively leverage the docker run command similar to node_exporter, but using a local volume mount instead of a config.
Once these two processes are up and running you should be able to navigate to the UI in the browser.
$ open http://${ip_address}:9090   # prometheus
$ open http://${ip_address}:3000   # graphana

## on linux, this will be "xdg-open" instead of "open"
Adding Prometheus as a data source to Graphana
Once you have the Graphana interface open, you’ll need to configure a data source.
Graphana supports Prometheus as a data source out of box, so connecting them is easy.
In the address line, you’ll want to point it at your Prometheus server.
For me, this was http://prometheus:9090.
By default, docker sets up an overlay network across containers in a compose file.
This means that we’re able to connect services on the same network using their hostname.
Adding dashboards
Once the data source has been configured, you can start adding dashboards to Graphana. Graphana offers tons of pre-built dashboards. They’re mostly community driven, so finding a well maintained dashboard can be difficult. The first dashboard I found extremely useful is the full export of all node_exporter metrics.
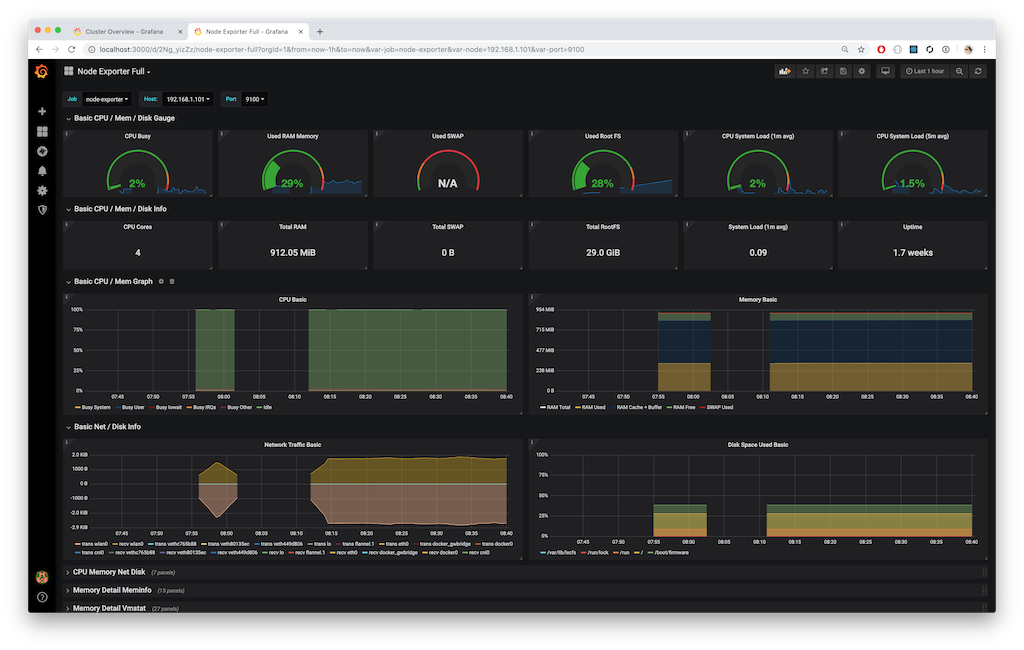
Using this dashboard, I’m able to get a detailed view of each node. It encapsulates all metrics emitted by node_exporter into a single dashboard. While this might seem overwhelming, the dashboard collapses the more detailed panels. This makes it easy to get a high level view of a node, and then dive in.
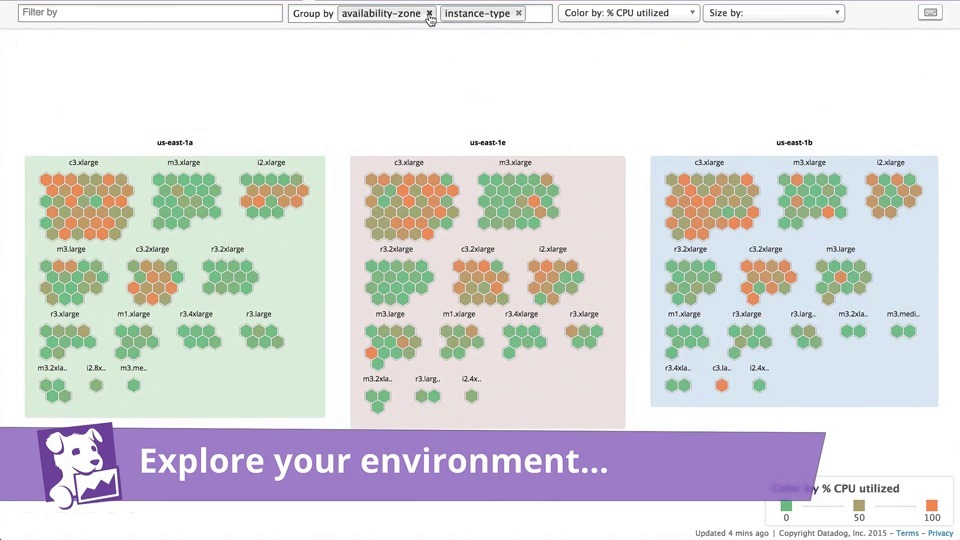
One thing that this dashboard did not enable was a complete overview of all nodes in the cluster. In the past, this kind of dashboard has been extremely useful when investigating capacity constraints. In Datadog, this was a rather easy thing to setup:
After looking around for a bit, I wasn’t able to find a rough equivalent. So I started to build and prototype my own. First, I started with a few of the queries from the Node Exporter Full dashboard. With a few modifications, I was able to get something started.
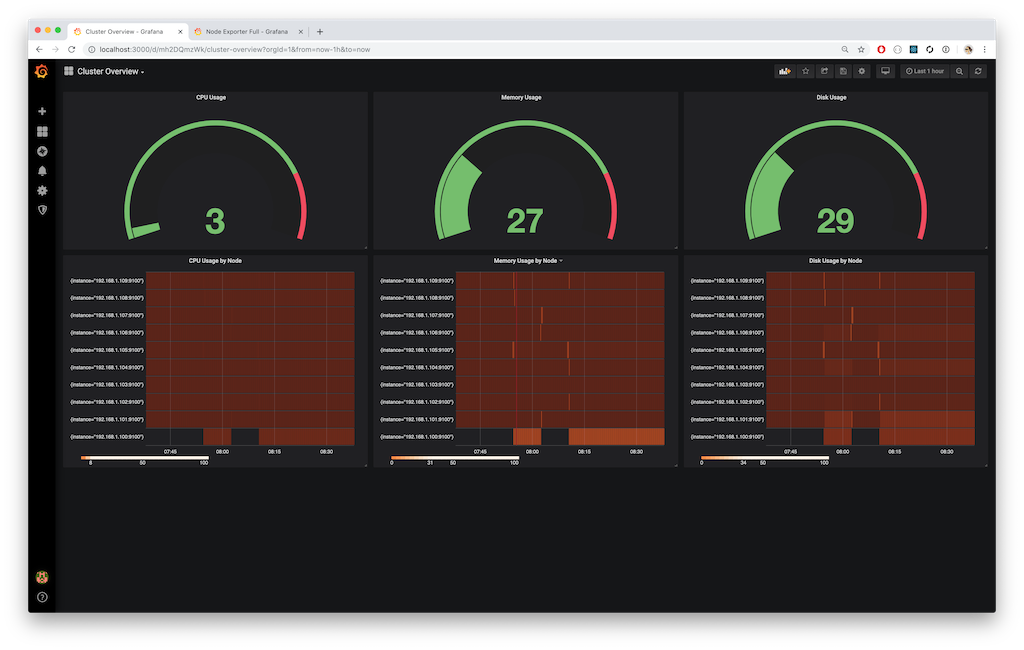
While it may not look as nice as the host map in Datadog, I was able to get the same view of information. First, I look for the capacity of the cluster as a whole. The three gauges along the top monitor the current clusters usage across all nodes. The 3 heat maps along the bottom show the same usage broken down by each instance in the cluster, over time. This allows me to be able to track drastic changes in compute, memory, or disk back to an originating point.
Using the combination of these dashboard, I can quickly get an idea of what my cluster is doing at any given time. Should I require more orchestrator related information, then I can follow up with their supplied monitoring. For Docker, I use portainer. For Kubernetes and K3s, I use the kubernetes-dashboard. In Nomad, I’ll use the Nomad and Consul views.